The wake passing effect in LPTs with Nektar++
In a gas turbine engine, the pressure expansion through the high- and low-pressure turbines (LPT) is achieved in a number of subsequent stages. The interaction of multiple stages of rotors and stators is a crucial source of deterministic unsteadiness which has repercussions on the loss production mechanisms, and it is thus of great importance to designers [1].
To model the bar passing effect, the Smoothed Profile Method (SPM) approach [2, 3] was adopted and incorporated in the Nektar++ framework. Extensive preliminary validation was carried out to ensure the generation of a realistic cylinder wake. As part of the SPM formulation, an interface thickness parameter must be selected to represent the rigid particles. The interface thickness was selected to ensure accurate representation of the SPM boundaries (thus driven by resolution requirements). An auxiliary study focused on varying the diameter of the cylinders at fixed interface thickness. A smaller bar diameter of 60% the width of the nominal diameter produced wake profiles and spectral characteristics that very closely match those of a corresponding DNS simulation over the entire range of Reynolds numbers analysed.
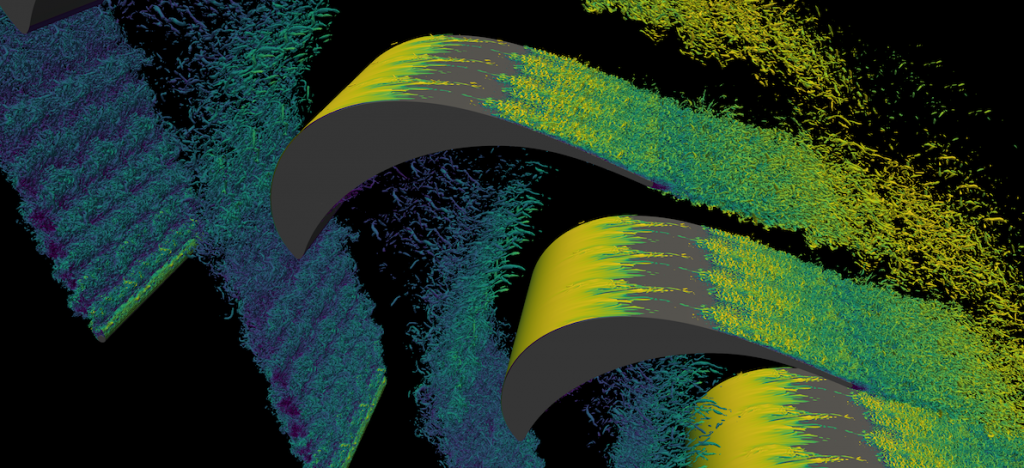
The qualitative result of the wake passing effect at high Reynolds number (Re=300000) is shown in the Figure below. The initial stage of wake bending is visible, while the suction surface transition leads to fully turbulent boundary layer at the trailing edge.
The time averaging operation masks the wealth of flow phenomena occurring in the boundary layer of LPTs subject to incoming disturbances, and it particularly fails to highlight the presence of high-amplitude events that precede the onset of turbulence. Some instantaneous flow statistics are highlighted in the Figure below, which shows the wealth of flow phenomena occurring on the suction surface of the cascade at various phases of the wake passing cycle, denoted with φ, at Re=86000.
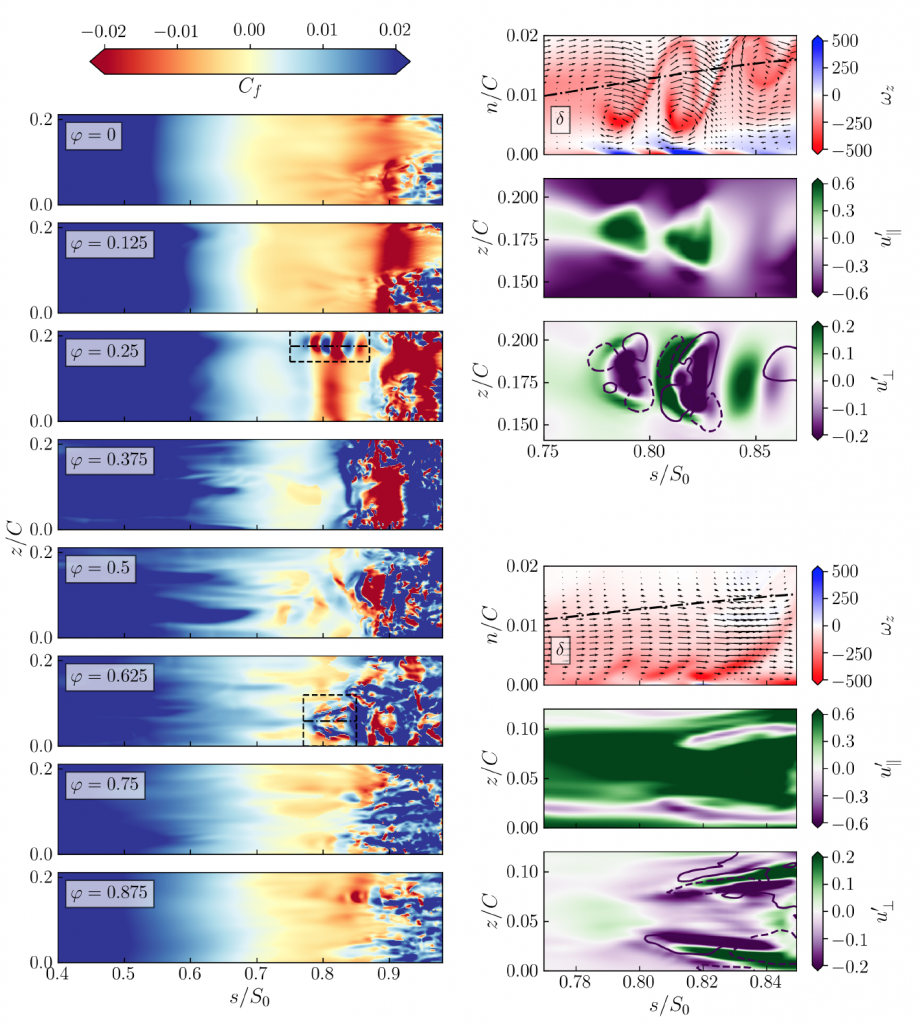
The left Figure shows the skin-friction coefficient carpet plot on the aft portion of the suction surface, at 8 different phases. The dashed boxes at φ=0.25 and φ=0.625 are expanded in more detail on the right. In the two right figures, the top figure shows the spanwise vorticity in the blade-normal plane denoted with dash-dotted lines. The middle and bottom figures show respectively wall-parallel and wall-normal fluctuating velocity n/C=0.01 away from the wall. The solid and dashed lines in the bottom right figures in are isolines of w’.
The dashed boxes highlight the presence of boundary layer instabilities driven by the periodic external disturbances, which trigger the emergence of so-called boundary layer streaks (spanwise-alternating patterns of high- and low-speed streamwise flow). As these flow structures evolve, they may locally undergo instability promoting transition to turbulence.
The modified transition mechanism due to the presence of wake passing is also characterised by a calmed region trailing the evolution of the turbulent spots discussed above. The calmed region has beneficial effects, as it is characterised by a full velocity profile, and it can resist transition and separation. It was argued that maximum performance is obtained if the blade design is such that as the new wake arrives, the calmed region is advected past the trailing edge. In these conditions, profile losses (especially at low Reynolds number) in a cascade with wake passing are lower than the corresponding losses without the disturbances.
The numerical approach here described further yielded extremely close agreement with existing experimental data in the entire operating range.